


A useful operations dashboard does not just show numbers. It tells the team what needs attention next.
Operations dashboard KPIs should help leaders see whether work is moving, where it is stuck, who owns the next step, and whether the system is improving. The mistake is treating the dashboard as a reporting surface only. A good dashboard is an operating rhythm: it turns scattered activity into visible signals that trigger decisions.
This matters because operations work is rarely one clean workflow. Requests arrive from customers, managers, vendors, field teams, contractors, finance, and leadership. Work moves across handoffs, approvals, exceptions, schedules, documents, payments, and status updates. Without a shared dashboard, teams often manage the business from meetings, spreadsheets, chat threads, and overdue reminders.
What’s in this article?
- How to choose operations dashboard KPIs without tracking everything
- The core KPI groups every operations team should consider
- A practical dashboard structure with owners, thresholds, and review cadence
- Common mistakes that make dashboards noisy or ignored
- Where Workhint fits when a dashboard needs to become a live operating system
Why operations dashboard KPIs matter
Microsoft Power BI describes KPI dashboards as tools for tracking performance, making data-driven decisions, and staying aligned with goals. That framing is useful, but operations teams need one more layer: action. The dashboard should not only report performance; it should show what the team should do when performance changes.
Qlik notes that operational dashboards are commonly used to monitor current conditions in a simple, easy-to-view format. That distinction matters. A strategic dashboard might review quarterly progress. An operations dashboard should help someone decide what needs attention today, this week, or before the next customer, worker, shipment, project, or approval is affected.
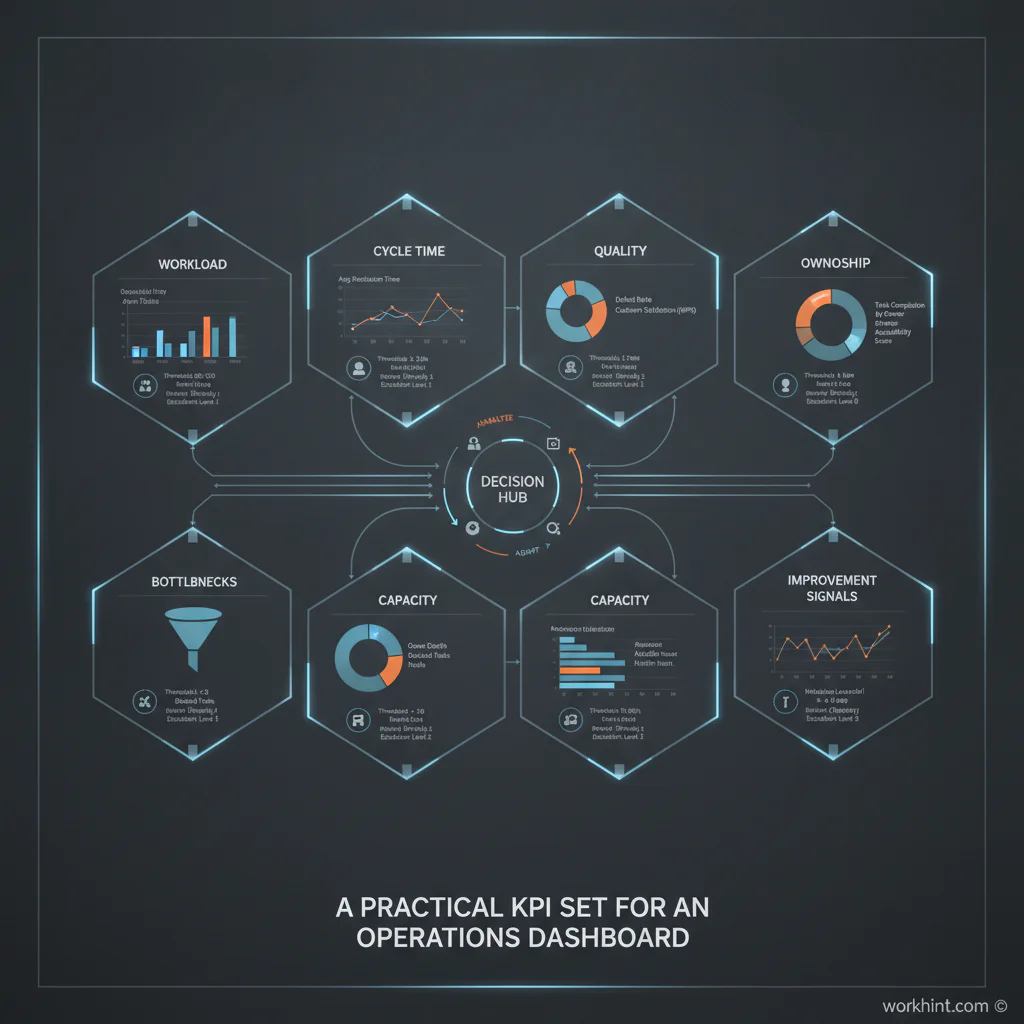
A practical KPI set for an operations dashboard
Start with seven KPI groups. Do not add every metric available. Pick the smallest set that shows the health of the work system and gives leaders enough context to act.
| KPI group | What it shows | Example metrics | Action trigger |
|---|---|---|---|
| Workload | How much work is entering and sitting in the system | New requests, open work items, backlog age | Rebalance intake or pause low-priority work |
| Speed | How quickly work moves from start to finish | Cycle time, time to first response, approval time | Investigate delays and shorten handoffs |
| Quality | Whether work is completed correctly | Rework rate, error rate, failed checks, reopened items | Fix instructions, forms, training, or review steps |
| Ownership | Whether each item has a clear accountable person | Unassigned items, overdue owner actions, aging by owner | Assign an owner or escalate blocked work |
| Bottlenecks | Where work stalls | Queue time by step, approval backlog, dependency waits | Change routing, capacity, or authority |
| Capacity | Whether teams can absorb incoming work | Utilization, active work per person, forecasted load | Shift resources or adjust commitments |
| Improvement | Whether the system is getting better | Trend by week, exception rate, resolved blockers | Review process changes and keep what works |
Geckoboard’s operations dashboard examples show how varied operational dashboards can be across IT, OKRs, health and safety, inventory, and warehouse operations. That variety is the point: the dashboard must fit the work being managed. A field services dashboard should not look like a recruiting operations dashboard. A vendor approval dashboard should not look like a support queue dashboard.
How to design the dashboard as a work system
Use this workflow before building charts:
- Define the operating question. Write the question the dashboard must answer. For example: Are requests being handled within SLA without overloading the team?
- Map the work path. List the major states work passes through: intake, triage, approval, assignment, delivery, review, closeout, and reporting.
- Select one to three metrics per state. Too many metrics dilute accountability. Each metric should change a decision.
- Assign a metric owner. Every KPI needs someone responsible for data quality, interpretation, and follow-up.
- Set thresholds. Define green, watch, and intervention levels. Avoid dashboards that show red numbers but no escalation rule.
- Choose refresh cadence. Daily is useful for active operations. Weekly may work for improvement trends. Monthly is too slow for many execution problems.
- Create the review ritual. Decide who reviews the dashboard, when, what decisions are made, and how actions are tracked.
What to track first
If the team is starting from spreadsheets or manual reporting, begin with five metrics: open work items, aged backlog, cycle time, overdue approvals, and unassigned items. These reveal whether work exists, whether it is stale, whether it is moving, whether decisions are blocking progress, and whether ownership is clear.
Then add metrics that match the operating model. A marketplace operations team may track provider onboarding time, fulfillment rate, dispute rate, payment exceptions, and customer response time. A professional services team may track request volume, project start delay, utilization, milestone slippage, and rework. An internal operations team may track service requests, SLA misses, recurring blockers, handoff delays, and cross-functional dependencies.
Common mistakes that make dashboards fail
- Tracking activity instead of outcomes. Completed tasks may rise while cycle time, customer experience, or rework gets worse.
- Using metrics with no owner. A KPI without an accountable person becomes background noise.
- Mixing strategic and operational views. Executives may need trends; operators need current exceptions and next actions.
- Reporting averages only. Averages hide aging work, outliers, and overloaded teams.
- No threshold logic. Teams need to know when a metric means observe, intervene, escalate, or redesign the process.
Klipfolio’s operations dashboard examples cover different business functions and show how metrics vary by team. Use that as a reminder that the goal is not a universal KPI list. The goal is a dashboard that reflects the system your team actually runs.
Where Workhint fits
Workhint fits when the dashboard needs to connect to the work itself. A dashboard built from disconnected tools can show a problem, but the team still has to chase forms, owners, approvals, assignments, schedules, documents, and updates elsewhere.
In Workhint, an operations team can turn the dashboard logic into a live work system: intake forms capture the right fields, routing rules assign the right owner, approvals follow defined thresholds, escalations trigger when work ages, dashboards show current status, and reports connect outcomes back to the process. The dashboard becomes part of how work is orchestrated, not a static report assembled after the fact.
FAQ
How many KPIs should an operations dashboard have?
Most teams should start with 8 to 15 KPIs across workload, speed, quality, ownership, bottlenecks, capacity, and improvement. If the dashboard has more than that, split it into an executive summary and a working operations view.
What is the difference between an operations dashboard and a KPI dashboard?
A KPI dashboard can track performance for many business areas. An operations dashboard focuses on the current health of work: volume, flow, blockers, ownership, quality, capacity, and exceptions that need attention.
Who should own operations dashboard KPIs?
Each KPI should have a business owner who can explain the metric and act on it. Data teams may support the dashboard, but operations leaders should own the meaning, thresholds, and follow-up process.
How often should an operations dashboard be reviewed?
Active operations dashboards should usually be reviewed daily or weekly. The right cadence depends on how quickly work changes and how much delay the business can tolerate before customers, workers, revenue, or compliance are affected.
Conclusion
The best operations dashboard KPIs do more than measure the business. They make work visible, expose weak handoffs, clarify ownership, and help teams improve the system that produces results. Start with the decisions the dashboard must support, then choose metrics, owners, thresholds, and review rhythms around those decisions. That is how a dashboard becomes part of the operating system instead of another report nobody has time to use.
Leave a Reply